Spaces:
Running
on
Zero
Running
on
Zero
File size: 14,629 Bytes
2e37c6a f4c379b 839f10e 9e56ba5 5abe39b 1f32ffc 74a077f ed52d42 74a077f 1f32ffc 9e56ba5 86b060d fbf7466 9e56ba5 2e37c6a 839f10e 9e56ba5 839f10e 9e56ba5 839f10e 9e56ba5 74a077f 839f10e 1f32ffc e2da6d0 9e56ba5 c5064a3 839f10e 1935572 839f10e 1935572 e2da6d0 839f10e e2da6d0 839f10e 9e56ba5 03d7fe4 9e56ba5 905c48c 1f32ffc 17d720c 1f32ffc fd60a59 1f32ffc e2da6d0 fd60a59 1f32ffc fd60a59 1f32ffc 1729f65 0a4b86a 30c59c4 0a4b86a 5417ed8 8c460f6 5f53c3e 0a4b86a 5417ed8 0a4b86a 5417ed8 0a4b86a 5417ed8 0a4b86a 5417ed8 0a4b86a 5417ed8 0a4b86a 5417ed8 0a4b86a 5417ed8 0a4b86a 5417ed8 0a4b86a 5417ed8 0a4b86a 5417ed8 0a4b86a 5417ed8 0a4b86a 5417ed8 0a4b86a 5417ed8 0a4b86a 5417ed8 0a4b86a 5417ed8 0a4b86a 5417ed8 0a4b86a 5417ed8 0a4b86a 5417ed8 0a4b86a 167a63f 1f32ffc ed52d42 86b060d ed52d42 76c31e9 ed52d42 ee00b10 9d353b9 2f49584 63c0b9b 313602e f574afb 9d353b9 ee00b10 9d353b9 ee00b10 9d353b9 ee00b10 ed52d42 912adfe e8d1baa f4cdfeb e8d1baa 912adfe 5dd6bd8 ed52d42 5abe39b 313602e 4ccca01 9d353b9 1f32ffc ed52d42 1f32ffc ed52d42 9e56ba5 fd60a59 a5da580 ed52d42 dfc0d9b ed52d42 a5da580 |
1 2 3 4 5 6 7 8 9 10 11 12 13 14 15 16 17 18 19 20 21 22 23 24 25 26 27 28 29 30 31 32 33 34 35 36 37 38 39 40 41 42 43 44 45 46 47 48 49 50 51 52 53 54 55 56 57 58 59 60 61 62 63 64 65 66 67 68 69 70 71 72 73 74 75 76 77 78 79 80 81 82 83 84 85 86 87 88 89 90 91 92 93 94 95 96 97 98 99 100 101 102 103 104 105 106 107 108 109 110 111 112 113 114 115 116 117 118 119 120 121 122 123 124 125 126 127 128 129 130 131 132 133 134 135 136 137 138 139 140 141 142 143 144 145 146 147 148 149 150 151 152 153 154 155 156 157 158 159 160 161 162 163 164 165 166 167 168 169 170 171 172 173 174 175 176 177 178 179 180 181 182 183 184 185 186 187 188 189 190 191 192 193 194 195 196 197 198 199 200 201 202 203 204 205 206 207 208 209 210 211 212 213 214 215 216 217 218 219 220 221 222 223 224 225 226 227 228 229 230 231 232 233 234 235 236 237 238 239 240 241 242 243 244 245 246 247 248 249 250 251 252 253 254 255 256 257 258 259 260 261 262 263 264 265 266 267 268 269 270 271 272 273 274 275 276 277 278 279 280 281 282 283 284 285 286 287 288 289 290 291 292 293 294 295 296 297 298 299 300 301 302 303 304 305 306 307 |
import spaces
import gradio as gr
from detect_deepsort import run_deepsort
from detect_strongsort import run_strongsort
from detect import run
import os
import torch
import seaborn as sns
from PIL import Image
import cv2
import numpy as np
import matplotlib.pyplot as plt
import threading
from scipy.interpolate import make_interp_spline
import pandas as pd
should_continue = True
@spaces.GPU(duration=240)
def yolov9_inference(model_id, img_path=None, vid_path=None, tracking_algorithm = None):
global should_continue
img_extensions = ['.jpg', '.jpeg', '.png', '.gif'] # Add more image extensions if needed
vid_extensions = ['.mp4', '.avi', '.mov', '.mkv'] # Add more video extensions if needed
#assert img_path is not None or vid_path is not None, "Either img_path or vid_path must be provided."
image_size = 640
conf_threshold = 0.5
iou_threshold = 0.5
input_path = None
output_path = None
if img_path is not None:
# Convert the numpy array to an image
img = Image.fromarray(img_path)
img_path = 'output.png'
# Save the image
img.save(img_path)
input_path = img_path
output_path, df, frame_counts_df = run(weights=model_id, imgsz=(image_size,image_size), conf_thres=conf_threshold, iou_thres=iou_threshold, source=input_path, device='0', hide_conf= True, hide_labels = True)
elif vid_path is not None:
vid_name = 'output.mp4'
# Create a VideoCapture object
cap = cv2.VideoCapture(vid_path)
# Check if video opened successfully
if not cap.isOpened():
print("Error opening video file")
# Read the video frame by frame
frames = []
while cap.isOpened():
ret, frame = cap.read()
if ret:
frames.append(frame)
else:
break
# Release the VideoCapture object
cap.release()
# Convert the list of frames to a numpy array
vid_data = np.array(frames)
# Create a VideoWriter object
out = cv2.VideoWriter(vid_name, cv2.VideoWriter_fourcc(*'mp4v'), 30, (frames[0].shape[1], frames[0].shape[0]))
# Write the frames to the output video file
for frame in frames:
out.write(frame)
# Release the VideoWriter object
out.release()
input_path = vid_name
if tracking_algorithm == 'deep_sort':
output_path, df, frame_counts_df = run_deepsort(weights=model_id, imgsz=(image_size,image_size), conf_thres=conf_threshold, iou_thres=iou_threshold, source=input_path, device='0', draw_trails=True)
elif tracking_algorithm == 'strong_sort':
device_strongsort = torch.device('cuda:0')
output_path, df, frame_counts_df = run_strongsort(yolo_weights=model_id, imgsz=(image_size,image_size), conf_thres=conf_threshold, iou_thres=iou_threshold, source=input_path, device=device_strongsort, strong_sort_weights = "osnet_x0_25_msmt17.pt", hide_conf= True,hide_labels = True)
else:
output_path, df, frame_counts_df = run(weights=model_id, imgsz=(image_size,image_size), conf_thres=conf_threshold, iou_thres=iou_threshold, source=input_path, device='0', hide_conf= True, hide_labels = True)
# Assuming output_path is the path to the output file
_, output_extension = os.path.splitext(output_path)
palette = {"Bus": "red", "Bike": "blue", "Car": "green", "Pedestrian": "yellow", "Truck": "purple"}
if output_extension.lower() in img_extensions:
output_image = output_path # Load the image file here
output_video = None
plt.style.use("ggplot")
fig, ax = plt.subplots(figsize=(10, 6), dpi = 300)
#for label in labels:
#df_label = frame_counts_df[frame_counts_df['label'] == label]
sns.barplot(ax=ax, data=df, x='label', y='count', palette=palette, hue='label')
# Customizations
ax.set_title('Number of Objects', fontsize=20, pad=20) # Increase padding for the title
ax.set_xlabel('Object Class', fontsize=16) # Increase font size
ax.set_ylabel('Object Count', fontsize=16) # Increase font size
ax.tick_params(axis='x', rotation=45, labelsize=12) # Increase label size and rotate x-axis labels for better readability
ax.tick_params(axis='y', labelsize=12) # Increase label size for y-axis
sns.despine() # Remove the top and right spines from plot
# Add grid but make it lighter and put it behind bars
ax.grid(True, linestyle=':', linewidth=0.6, color='gray', alpha=0.6)
ax.set_axisbelow(True)
# Add a legend with a smaller font size
ax.legend(fontsize=10)
plt.tight_layout() # Ensure the entire plot fits into the figure area
#ax.set_facecolor('#D3D3D3')
elif output_extension.lower() in vid_extensions:
output_video = output_path # Load the video file here
output_image = None
plt.style.use("ggplot")
fig, ax = plt.subplots(figsize=(10, 6), dpi = 300)
#for label in labels:
#df_label = frame_counts_df[frame_counts_df['label'] == label]
sns.lineplot(ax = ax, data = frame_counts_df, x = 'frame', y = 'count', hue = 'label', palette=palette,linewidth=2.5)
ax.set_title('Object count over frame', fontsize=20, pad=20) # Increase padding for the title
ax.set_xlabel('Frame', fontsize=16) # Increase font size
ax.set_ylabel('Object Count', fontsize=16) # Increase font size
ax.tick_params(axis='x', labelsize=12) # Increase label size for x-axis
ax.tick_params(axis='y', labelsize=12) # Increase label size for y-axis
# Add grid but make it lighter and put it behind bars
ax.grid(True, linestyle=':', linewidth=0.6, color='gray', alpha=0.6)
ax.set_axisbelow(True)
# Change the background color to a lighter shade
ax.set_facecolor('#F0F0F0')
# Add a legend with a smaller font size
ax.legend(fontsize=10)
plt.tight_layout() # Ensure the entire
# output_video = output_path
# output_image = None
# # Interpolation preprocessing
# interpolated_data = []
# labels = frame_counts_df['label'].unique()
# for label in labels:
# df_label = frame_counts_df[frame_counts_df['label'] == label]
# # Sort data by frame to ensure smooth interpolation
# df_label = df_label.sort_values('frame')
# # Original data points
# x = df_label['frame']
# y = df_label['count']
# # Check if we have enough points for interpolation
# if len(x) > 1:
# # Create spline interpolation
# x_smooth = np.linspace(x.min(), x.max(), 500)
# spline = make_interp_spline(x, y, k=3) # Cubic spline interpolation
# y_smooth = spline(x_smooth)
# # Append the smoothed data to the list
# interpolated_data.append(pd.DataFrame({'frame': x_smooth, 'count': y_smooth, 'label': label}))
# # Concatenate all interpolated data into a single DataFrame
# if interpolated_data:
# interpolated_df = pd.concat(interpolated_data)
# else:
# interpolated_df = pd.DataFrame(columns=['frame', 'count', 'label'])
# plt.style.use("ggplot")
# fig, ax = plt.subplots(figsize=(10, 6))
# # Plot using Seaborn
# sns.lineplot(ax=ax, data=interpolated_df, x='frame', y='count', hue='label', palette=palette, linewidth=2.5)
# ax.set_title('Number of Objects over Seconds', fontsize=20, pad=20) # Increase padding for the title
# ax.set_xlabel('Second', fontsize=16) # Increase font size
# ax.set_ylabel('Object Count', fontsize=16) # Increase font size
# ax.tick_params(axis='x', labelsize=12) # Increase label size for x-axis
# ax.tick_params(axis='y', labelsize=12) # Increase label size for y-axis
# # Add grid but make it lighter and put it behind bars
# ax.grid(True, linestyle=':', linewidth=0.6, color='gray', alpha=0.6)
# ax.set_axisbelow(True)
# # Change the background color to a lighter shade
# ax.set_facecolor('#F0F0F0')
# # Add a legend with a smaller font size
# ax.legend(fontsize=10)
# plt.tight_layout() # Ensure the entire plot is visible
return output_image, output_video, fig
def app():
img = Image.open('./img_examples/classes.png')
img = img.resize((410, 260), Image.Resampling.LANCZOS)
img = np.array(img)
with gr.Blocks(title="YOLOv9: Real-time Object Detection", css=".gradio-container {background:lightyellow;}"):
with gr.Row():
with gr.Column():
gr.HTML("<h2>Input</h2>")
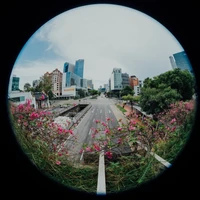
img_path = gr.Image(label="Image", height = 260, width = 410)
vid_path = gr.Video(label="Video", height = 260, width = 410)
#gr.HTML("<img src='flie/img_examples/clasess.png'>")
# gr.HTML("""
# <h2>Classes (Color)</h2>
# <ul>
# <li><span style="color:#FF3333">■</span> Bus</li>
# <li><span style="color:#3358FF">■</span> Bike</li>
# <li><span style="color:#33FF33">■</span> Car</li>
# <li><span style="color:#F6FF33">■</span> Pedestrian</li>
# <li><span style="color:#9F33FF">■</span> Truck</li>
# </ul>
# """)
# gr.HTML("""
# <h2>Classes (Color)</h2>
# <ul>
# <li style="font-size:17px;"><span style="color:#FF3333">■</span> Bus</li>
# <li style="font-size:17px;"><span style="color:#3358FF">■</span> Bike</li>
# <li style="font-size:17px;"><span style="color:#33FF33">■</span> Car</li>
# <li style="font-size:17px;"><span style="color:#F6FF33">■</span> Pedestrian</li>
# <li style="font-size:17px;"><span style="color:#9F33FF">■</span> Truck</li>
# </ul>
# """)
#gr.Image(value = img, interactive = False, label = "Classes", height = 260, width = 410)
#gr.Examples(['./img_examples/Exam_1.png','./img_examples/Exam_2.png','./img_examples/Exam_3.png','./img_examples/Exam_4.png','./img_examples/Exam_5.png'], inputs=img_path,label = "Image Example", cache_examples = False)
#gr.Examples(['./video_examples/video_1.mp4', './video_examples/video_2.mp4','./video_examples/video_3.mp4','./video_examples/video_4.mp4','./video_examples/video_5.mp4'], inputs=vid_path, label = "Video Example", cache_examples = False)
with gr.Column(min_width = 270):
gr.HTML("<h2>Output</h2>")
output_image = gr.Image(type="numpy",label="Output Image", height = 260, width = 410)
#df = gr.BarPlot(show_label=False, x="label", y="counts", x_title="Labels", y_title="Counts", vertical=False)
output_video = gr.Video(label="Output Video", height = 260, width = 410)
#frame_counts_df = gr.LinePlot(show_label=False, x="frame", y="count", x_title="Frame", y_title="Counts", color="label")
fig = gr.Plot(label = "label")
#output_path = gr.Textbox(label="Output path")
with gr.Column():
gr.HTML("<h2>Configuration</h2>")
model_id = gr.Dropdown(
label="Model",
choices=[
"Our_model-e.pt",
"Our_model-c-dev.pt",
"yolov9-e_trained.pt",
"yolov9-c_trained.pt",
],
value="Our_model-e.pt"
)
tracking_algorithm = gr.Dropdown(
label= "Tracking Algorithm",
choices=[
"None",
"deep_sort",
"strong_sort"
],
value="None"
)
yolov9_infer = gr.Button(value="Inference")
gr.HTML("""
<p style="text-align:center; font-family:Arial; font-size:16px;">
<span style="display:inline-block; width:8px; height:8px; background:#FF3333;"></span> Bus
<span style="display:inline-block; width:8px; height:8px; background:#3358FF;"></span> Bike
<span style="display:inline-block; width:8px; height:8px; background:#33FF33;"></span> Car
<span style="display:inline-block; width:8px; height:8px; background:#F6FF33;"></span> Pedestrian
<span style="display:inline-block; width:8px; height:8px; background:#9F33FF;"></span> Truck
</p>
""")
gr.Examples(['./img_examples/Exam_1.png','./img_examples/Exam_2.png','./img_examples/Exam_3.png','./img_examples/Exam_4.png','./img_examples/Exam_5.png'], inputs=img_path,label = "Image Example", cache_examples = False, examples_per_page = 4)
gr.Examples(['./video_examples/video_1.mp4', './video_examples/video_2.mp4','./video_examples/video_3.mp4','./video_examples/video_4.mp4','./video_examples/video_5.mp4'], inputs=vid_path, label = "Video Example", cache_examples = False, examples_per_page = 4)
yolov9_infer.click(
fn=yolov9_inference,
inputs=[
model_id,
img_path,
vid_path,
tracking_algorithm
],
outputs=[output_image, output_video, fig],
)
gradio_app = gr.Blocks(title= "YOLOv9-FishEye")
with gradio_app:
gr.HTML(
"""
<h1 style='text-align: center'>
YOLOv9-FishEye: Improving model for realtime fisheye camera object detection
</h1>
""")
css = """
body {
background-color: #f0f0f0;
}
h1 {
color: #4CAF50;
}
"""
with gr.Row():
with gr.Column():
app()
gradio_app.launch(debug=True, favicon_path= "fisheye_icon.png")
|