Spaces:
Running
on
Zero
Running
on
Zero

| import spaces | |
| import gradio as gr | |
| from detect_deepsort import run_deepsort | |
| from detect_strongsort import run_strongsort | |
| from detect import run | |
| import os | |
| import torch | |
| import seaborn as sns | |
| from PIL import Image | |
| import cv2 | |
| import numpy as np | |
| import matplotlib.pyplot as plt | |
| import threading | |
| from scipy.interpolate import make_interp_spline | |
| import pandas as pd | |
| should_continue = True | |
| def yolov9_inference(model_id, img_path=None, vid_path=None, tracking_algorithm = None): | |
| global should_continue | |
| img_extensions = ['.jpg', '.jpeg', '.png', '.gif'] # Add more image extensions if needed | |
| vid_extensions = ['.mp4', '.avi', '.mov', '.mkv'] # Add more video extensions if needed | |
| #assert img_path is not None or vid_path is not None, "Either img_path or vid_path must be provided." | |
| image_size = 640 | |
| conf_threshold = 0.5 | |
| iou_threshold = 0.5 | |
| input_path = None | |
| output_path = None | |
| if img_path is not None: | |
| # Convert the numpy array to an image | |
| img = Image.fromarray(img_path) | |
| img_path = 'output.png' | |
| # Save the image | |
| img.save(img_path) | |
| input_path = img_path | |
| output_path, df, frame_counts_df = run(weights=model_id, imgsz=(image_size,image_size), conf_thres=conf_threshold, iou_thres=iou_threshold, source=input_path, device='0', hide_conf= True, hide_labels = True) | |
| elif vid_path is not None: | |
| vid_name = 'output.mp4' | |
| # Create a VideoCapture object | |
| cap = cv2.VideoCapture(vid_path) | |
| # Check if video opened successfully | |
| if not cap.isOpened(): | |
| print("Error opening video file") | |
| # Read the video frame by frame | |
| frames = [] | |
| while cap.isOpened(): | |
| ret, frame = cap.read() | |
| if ret: | |
| frames.append(frame) | |
| else: | |
| break | |
| # Release the VideoCapture object | |
| cap.release() | |
| # Convert the list of frames to a numpy array | |
| vid_data = np.array(frames) | |
| # Create a VideoWriter object | |
| out = cv2.VideoWriter(vid_name, cv2.VideoWriter_fourcc(*'mp4v'), 30, (frames[0].shape[1], frames[0].shape[0])) | |
| # Write the frames to the output video file | |
| for frame in frames: | |
| out.write(frame) | |
| # Release the VideoWriter object | |
| out.release() | |
| input_path = vid_name | |
| if tracking_algorithm == 'deep_sort': | |
| output_path, df, frame_counts_df = run_deepsort(weights=model_id, imgsz=(image_size,image_size), conf_thres=conf_threshold, iou_thres=iou_threshold, source=input_path, device='0', draw_trails=True) | |
| elif tracking_algorithm == 'strong_sort': | |
| device_strongsort = torch.device('cuda:0') | |
| output_path, df, frame_counts_df = run_strongsort(yolo_weights=model_id, imgsz=(image_size,image_size), conf_thres=conf_threshold, iou_thres=iou_threshold, source=input_path, device=device_strongsort, strong_sort_weights = "osnet_x0_25_msmt17.pt", hide_conf= True,hide_labels = True) | |
| else: | |
| output_path, df, frame_counts_df = run(weights=model_id, imgsz=(image_size,image_size), conf_thres=conf_threshold, iou_thres=iou_threshold, source=input_path, device='0', hide_conf= True, hide_labels = True) | |
| # Assuming output_path is the path to the output file | |
| _, output_extension = os.path.splitext(output_path) | |
| palette = {"Bus": "red", "Bike": "blue", "Car": "green", "Pedestrian": "yellow", "Truck": "purple"} | |
| if output_extension.lower() in img_extensions: | |
| output_image = output_path # Load the image file here | |
| output_video = None | |
| plt.style.use("ggplot") | |
| fig, ax = plt.subplots(figsize=(10, 6)) | |
| #for label in labels: | |
| #df_label = frame_counts_df[frame_counts_df['label'] == label] | |
| sns.barplot(ax=ax, data=df, x='label', y='count', palette=palette, hue='label') | |
| # Customizations | |
| ax.set_title('Number of Objects', fontsize=20, pad=20) # Increase padding for the title | |
| ax.set_xlabel('Object Class', fontsize=16) # Increase font size | |
| ax.set_ylabel('Object Count', fontsize=16) # Increase font size | |
| ax.tick_params(axis='x', rotation=45, labelsize=12) # Increase label size and rotate x-axis labels for better readability | |
| ax.tick_params(axis='y', labelsize=12) # Increase label size for y-axis | |
| sns.despine() # Remove the top and right spines from plot | |
| # Add grid but make it lighter and put it behind bars | |
| ax.grid(True, linestyle=':', linewidth=0.6, color='gray', alpha=0.6) | |
| ax.set_axisbelow(True) | |
| # Add a legend with a smaller font size | |
| ax.legend(fontsize=10) | |
| plt.tight_layout() # Ensure the entire plot fits into the figure area | |
| #ax.set_facecolor('#D3D3D3') | |
| elif output_extension.lower() in vid_extensions: | |
| # output_video = output_path # Load the video file here | |
| # output_image = None | |
| # plt.style.use("ggplot") | |
| # fig, ax = plt.subplots(figsize=(10, 6)) | |
| # #for label in labels: | |
| # #df_label = frame_counts_df[frame_counts_df['label'] == label] | |
| # sns.lineplot(ax = ax, data = frame_counts_df, x = 'frame', y = 'count', hue = 'label', palette=palette,linewidth=2.5) | |
| # ax.set_title('Number of Objects over Seconds', fontsize=20, pad=20) # Increase padding for the title | |
| # ax.set_xlabel('Second', fontsize=16) # Increase font size | |
| # ax.set_ylabel('Object Count', fontsize=16) # Increase font size | |
| # ax.tick_params(axis='x', labelsize=12) # Increase label size for x-axis | |
| # ax.tick_params(axis='y', labelsize=12) # Increase label size for y-axis | |
| # # Add grid but make it lighter and put it behind bars | |
| # ax.grid(True, linestyle=':', linewidth=0.6, color='gray', alpha=0.6) | |
| # ax.set_axisbelow(True) | |
| # # Change the background color to a lighter shade | |
| # ax.set_facecolor('#F0F0F0') | |
| # # Add a legend with a smaller font size | |
| # ax.legend(fontsize=10) | |
| # plt.tight_layout() # Ensure the entire | |
| output_video = output_path | |
| output_image = None | |
| # Interpolation preprocessing | |
| interpolated_data = [] | |
| labels = frame_counts_df['label'].unique() | |
| for label in labels: | |
| df_label = frame_counts_df[frame_counts_df['label'] == label] | |
| # Sort data by frame to ensure smooth interpolation | |
| df_label = df_label.sort_values('frame') | |
| # Original data points | |
| x = df_label['frame'] | |
| y = df_label['count'] | |
| # Check if we have enough points for interpolation | |
| if len(x) > 1: | |
| # Create spline interpolation | |
| x_smooth = np.linspace(x.min(), x.max(), 500) | |
| spline = make_interp_spline(x, y, k=3) # Cubic spline interpolation | |
| y_smooth = spline(x_smooth) | |
| # Append the smoothed data to the list | |
| interpolated_data.append(pd.DataFrame({'frame': x_smooth, 'count': y_smooth, 'label': label})) | |
| # Concatenate all interpolated data into a single DataFrame | |
| if interpolated_data: | |
| interpolated_df = pd.concat(interpolated_data) | |
| else: | |
| interpolated_df = pd.DataFrame(columns=['frame', 'count', 'label']) | |
| plt.style.use("ggplot") | |
| fig, ax = plt.subplots(figsize=(10, 6)) | |
| # Plot using Seaborn | |
| sns.lineplot(ax=ax, data=interpolated_df, x='frame', y='count', hue='label', palette=palette, linewidth=2.5) | |
| ax.set_title('Number of Objects over Seconds', fontsize=20, pad=20) # Increase padding for the title | |
| ax.set_xlabel('Second', fontsize=16) # Increase font size | |
| ax.set_ylabel('Object Count', fontsize=16) # Increase font size | |
| ax.tick_params(axis='x', labelsize=12) # Increase label size for x-axis | |
| ax.tick_params(axis='y', labelsize=12) # Increase label size for y-axis | |
| # Add grid but make it lighter and put it behind bars | |
| ax.grid(True, linestyle=':', linewidth=0.6, color='gray', alpha=0.6) | |
| ax.set_axisbelow(True) | |
| # Change the background color to a lighter shade | |
| ax.set_facecolor('#F0F0F0') | |
| # Add a legend with a smaller font size | |
| ax.legend(fontsize=10) | |
| plt.tight_layout() # Ensure the entire plot is visible | |
| return output_image, output_video, fig | |
| def app(): | |
| img = Image.open('./img_examples/classes.png') | |
| img = img.resize((410, 260), Image.Resampling.LANCZOS) | |
| img = np.array(img) | |
| with gr.Blocks(title="YOLOv9: Real-time Object Detection", css=".gradio-container {background:lightyellow;}"): | |
| with gr.Row(): | |
| with gr.Column(): | |
| gr.HTML("<h2>Input Parameters</h2>") | |
| img_path = gr.Image(label="Image", height = 260, width = 410) | |
| vid_path = gr.Video(label="Video", height = 260, width = 410) | |
| #gr.HTML("<img src='flie/img_examples/clasess.png'>") | |
| gr.HTML(""" | |
| <h2>Classes (Color)</h2> | |
| <ul> | |
| <li><span style="color:#FF3333">■</span> Bus</li> | |
| <li><span style="color:#3358FF">■</span> Bike</li> | |
| <li><span style="color:#33FF33">■</span> Car</li> | |
| <li><span style="color:#F6FF33">■</span> Pedestrian</li> | |
| <li><span style="color:#9F33FF">■</span> Truck</li> | |
| </ul> | |
| """) | |
| #gr.Image(value = img, interactive = False, label = "Classes", height = 260, width = 410) | |
| #gr.Examples(['./img_examples/Exam_1.png','./img_examples/Exam_2.png','./img_examples/Exam_3.png','./img_examples/Exam_4.png','./img_examples/Exam_5.png'], inputs=img_path,label = "Image Example", cache_examples = False) | |
| #gr.Examples(['./video_examples/video_1.mp4', './video_examples/video_2.mp4','./video_examples/video_3.mp4','./video_examples/video_4.mp4','./video_examples/video_5.mp4'], inputs=vid_path, label = "Video Example", cache_examples = False) | |
| with gr.Column(min_width = 270): | |
| gr.HTML("<h2>Output</h2>") | |
| output_image = gr.Image(type="numpy",label="Output", height = 260, width = 410) | |
| #df = gr.BarPlot(show_label=False, x="label", y="counts", x_title="Labels", y_title="Counts", vertical=False) | |
| output_video = gr.Video(label="Output", height = 260, width = 410) | |
| #frame_counts_df = gr.LinePlot(show_label=False, x="frame", y="count", x_title="Frame", y_title="Counts", color="label") | |
| fig = gr.Plot(label = "label") | |
| #output_path = gr.Textbox(label="Output path") | |
| with gr.Column(): | |
| gr.HTML("<h2>Example, Model and Tracking Algorithm</h2>") | |
| model_id = gr.Dropdown( | |
| label="Model", | |
| choices=[ | |
| "Our_Model.pt", | |
| "yolov9_e_trained.pt", | |
| "yolov9-c-converted.pt" | |
| ], | |
| value="Our_Model.pt" | |
| ) | |
| tracking_algorithm = gr.Dropdown( | |
| label= "Tracking Algorithm", | |
| choices=[ | |
| "None", | |
| "deep_sort", | |
| "strong_sort" | |
| ], | |
| value="None" | |
| ) | |
| yolov9_infer = gr.Button(value="Inference") | |
| gr.Examples(['./img_examples/Exam_1.png','./img_examples/Exam_2.png','./img_examples/Exam_3.png','./img_examples/Exam_4.png','./img_examples/Exam_5.png'], inputs=img_path,label = "Image Example", cache_examples = False, examples_per_page = 4) | |
| gr.Examples(['./video_examples/video_1.mp4', './video_examples/video_2.mp4','./video_examples/video_3.mp4','./video_examples/video_4.mp4','./video_examples/video_5.mp4'], inputs=vid_path, label = "Video Example", cache_examples = False, examples_per_page = 4) | |
| yolov9_infer.click( | |
| fn=yolov9_inference, | |
| inputs=[ | |
| model_id, | |
| img_path, | |
| vid_path, | |
| tracking_algorithm | |
| ], | |
| outputs=[output_image, output_video, fig], | |
| ) | |
| gradio_app = gr.Blocks() | |
| with gradio_app: | |
| gr.HTML( | |
| """ | |
| <h1 style='text-align: center'> | |
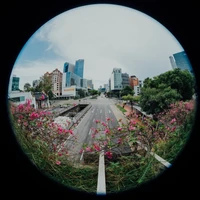
| YOLOv9-FishEye: Improving model for realtime fisheye camera object detection | |
| </h1> | |
| """) | |
| css = """ | |
| body { | |
| background-color: #f0f0f0; | |
| } | |
| h1 { | |
| color: #4CAF50; | |
| } | |
| """ | |
| with gr.Row(): | |
| with gr.Column(): | |
| app() | |
| gradio_app.launch(debug=True) | |